Analyzing stock charts is a critical skill for any investor or trader looking to maximize profits in the stock market. Whether you're a day trader, swing trader, or long-term investor, understanding how to interpret stock charts can help you make better decisions and identify lucrative opportunities. In this guide, we’ll break down the essentials of stock chart analysis, explore key tools and techniques, and provide actionable tips to help you get the most out of your trades.
Why Stock Chart Analysis Matters
Stock charts are visual representations of a stock’s price movement over time. They provide valuable insights into market trends, investor sentiment, and potential future price movements. By mastering stock chart analysis, you can:
- Identify trends and patterns that indicate potential buy or sell opportunities.
- Make informed decisions based on historical price data and market behavior.
- Improve your timing for entering and exiting trades.
- Reduce emotional decision-making by relying on data-driven insights.
Whether you're using charts for stock trading strategies or long-term investing, they are an indispensable tool for navigating the market.
Types of Stock Charts
There are several types of stock charts, each offering a unique perspective on price movements. Here are the most common ones:
1. Line Charts
Line charts are the simplest form of stock charts, showing the closing prices of a stock over a specific period. They are useful for identifying long-term trends but lack the detail needed for more advanced analysis.
2. Bar Charts
Bar charts provide more information than line charts, displaying the open, high, low, and close (OHLC) prices for each time period. Each bar represents a single trading session, making it easier to analyze price volatility.
3. Candlestick Charts
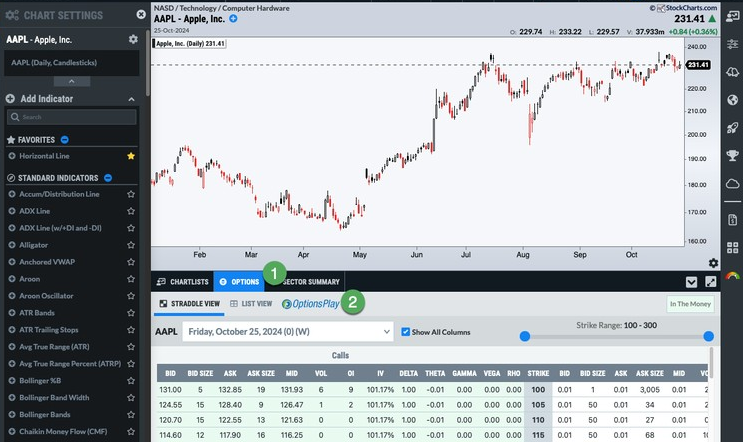
Candlestick charts are the most popular among traders due to their visual appeal and detailed information. Each candlestick shows the OHLC prices, with the body representing the range between the open and close, and the wicks (or shadows) showing the high and low. Candlestick patterns are widely used in technical analysis to predict future price movements.

4. Heikin-Ashi Charts
Heikin-Ashi charts are a variation of candlestick charts that smooth out price fluctuations, making it easier to identify trends. They are particularly useful for trend-following strategies.
Key Elements of Stock Chart Analysis
To effectively analyze stock charts, you need to understand the key elements that influence price movements. Here are the most important ones:
1. Trends
Trends are the foundation of stock chart analysis. They indicate the general direction of a stock’s price movement and can be classified as:
- Uptrend: Higher highs and higher lows, indicating bullish sentiment.
- Downtrend: Lower highs and lower lows, indicating bearish sentiment.
- Sideways Trend: Prices move within a narrow range, indicating consolidation.
Identifying trends early can help you align your trades with the market’s direction.
2. Support and Resistance
Support and resistance levels are key price points where a stock’s price tends to reverse. Support is the price level where buying pressure exceeds selling pressure, causing the price to bounce back up. Resistance is the price level where selling pressure exceeds buying pressure, causing the price to drop. These levels are crucial for determining entry and exit points.
3. Volume
Volume measures the number of shares traded during a specific period. It is a key indicator of the strength of a price movement. High volume during an uptrend or downtrend confirms the trend’s validity, while low volume may indicate a weak trend or potential reversal.
4. Technical Indicators
Technical indicators are mathematical calculations based on price and volume data. They help traders identify trends, momentum, and potential reversals. Some of the most popular indicators include:
- Moving Averages: These smooth out price data to identify trends. Common types include the Simple Moving Average (SMA) and Exponential Moving Average (EMA).
- Relative Strength Index (RSI): Measures the speed and change of price movements to identify overbought or oversold conditions.
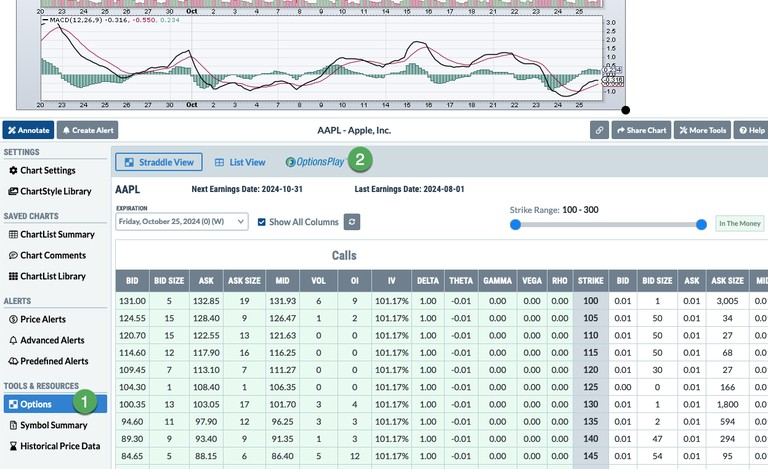
- MACD (Moving Average Convergence Divergence): Tracks the relationship between two moving averages to identify momentum and potential reversals.
Popular Chart Patterns
Chart patterns are specific formations that appear on stock charts and provide insights into future price movements. Here are some of the most widely used patterns:
1. Head and Shoulders
This pattern consists of three peaks, with the middle peak (the head) being the highest and the two outside peaks (the shoulders) being lower. It signals a potential reversal from an uptrend to a downtrend.
2. Double Top and Double Bottom
A double top occurs when a stock reaches a high price twice and fails to break through, signaling a potential reversal. A double bottom is the opposite, indicating a potential reversal from a downtrend to an uptrend.
3. Triangles
Triangles are continuation patterns that indicate a period of consolidation before the price breaks out in the direction of the prevailing trend. Types include ascending, descending, and symmetrical triangles.
4. Flags and Pennants
These short-term continuation patterns occur after a strong price movement and indicate a brief consolidation before the trend resumes.
How to Use Charts for Swing Trading
Swing trading stocks involves holding positions for several days or weeks to capitalize on short- to medium-term price movements. Charts are essential for identifying entry and exit points. Here’s how to use them:
- Identify trends using moving averages and trendlines.
- Look for chart patterns like triangles, flags, and head and shoulders to predict breakouts or reversals.
- Use technical indicators like RSI and MACD to confirm trade setups.
- Set stop-loss orders below support levels to manage risk.
Final Thoughts
Mastering stock chart analysis is a game-changer for anyone looking to maximize profits in the stock market. By understanding trends, support and resistance, volume, and technical indicators, you can make more informed decisions and improve your trading performance.
Remember, chart analysis is both an art and a science. It takes practice and patience to develop the skills needed to interpret charts effectively. Start by focusing on a few key tools and techniques, and gradually expand your knowledge as you gain experience. With dedication and the right approach, you can unlock the full potential of stock charts and achieve your financial goals.
